The world's best hyperlocal AI weather forecast  

Close the gap between predicting the weather and knowing it.

We built a weather AI that understands your microclimate and updates in minutes instead of hours.   

Our models are trained on millions of daily weather measurements from sensors we designed, deployed, and operate across the planet. They take in live data as it arrives and deliver updated forecasts within ten minutes - tailored to any location in the world.

68% more accurate than traditional forecasts

The energy reaching Europe - predicted twelve hours before it happens - with unmatched accuracy.

The new era of weather forecasting

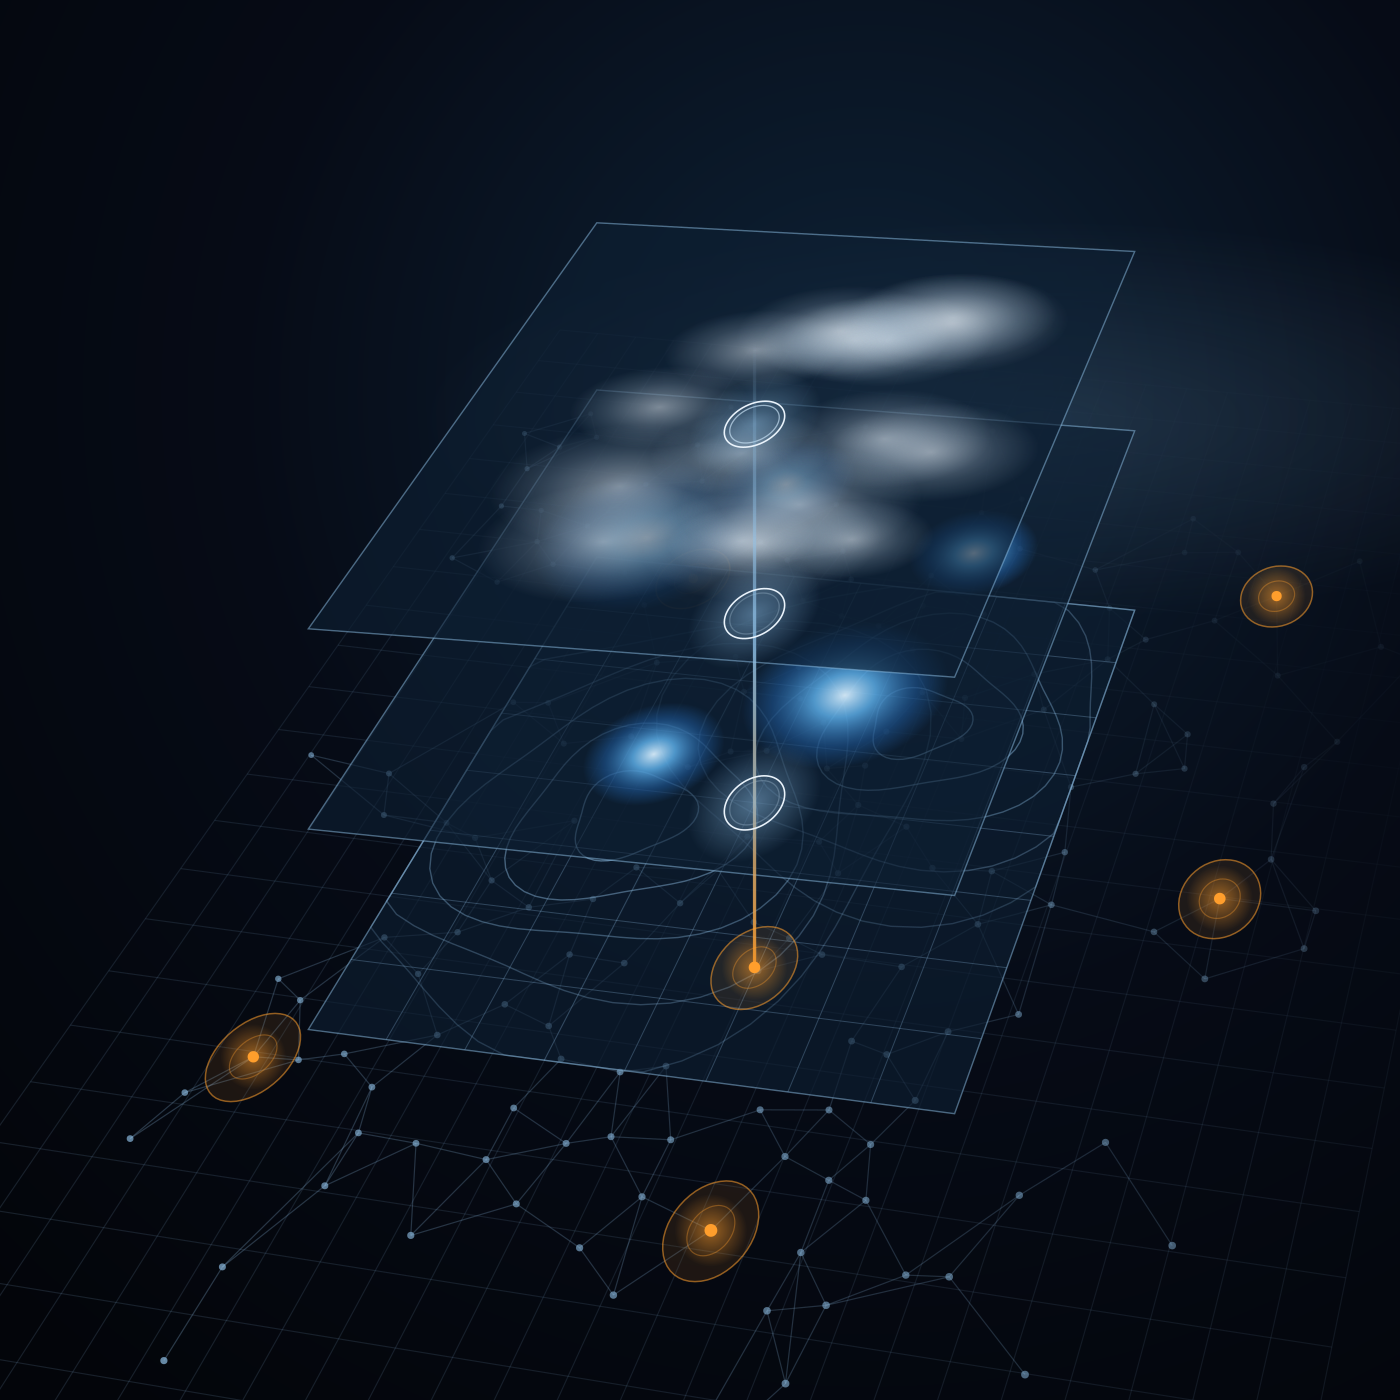
3D grid network of interconnected glowing points with orange circular markers and vertical light beams above selected nodes on a dark blue background.
Hyperlocal accuracy
Measurements from specific locations that you choose provide unparalleled accuracy that no gridded forecasts can provide.
Our own network
4.500 weather stations producing 3.5 million daily measurements.
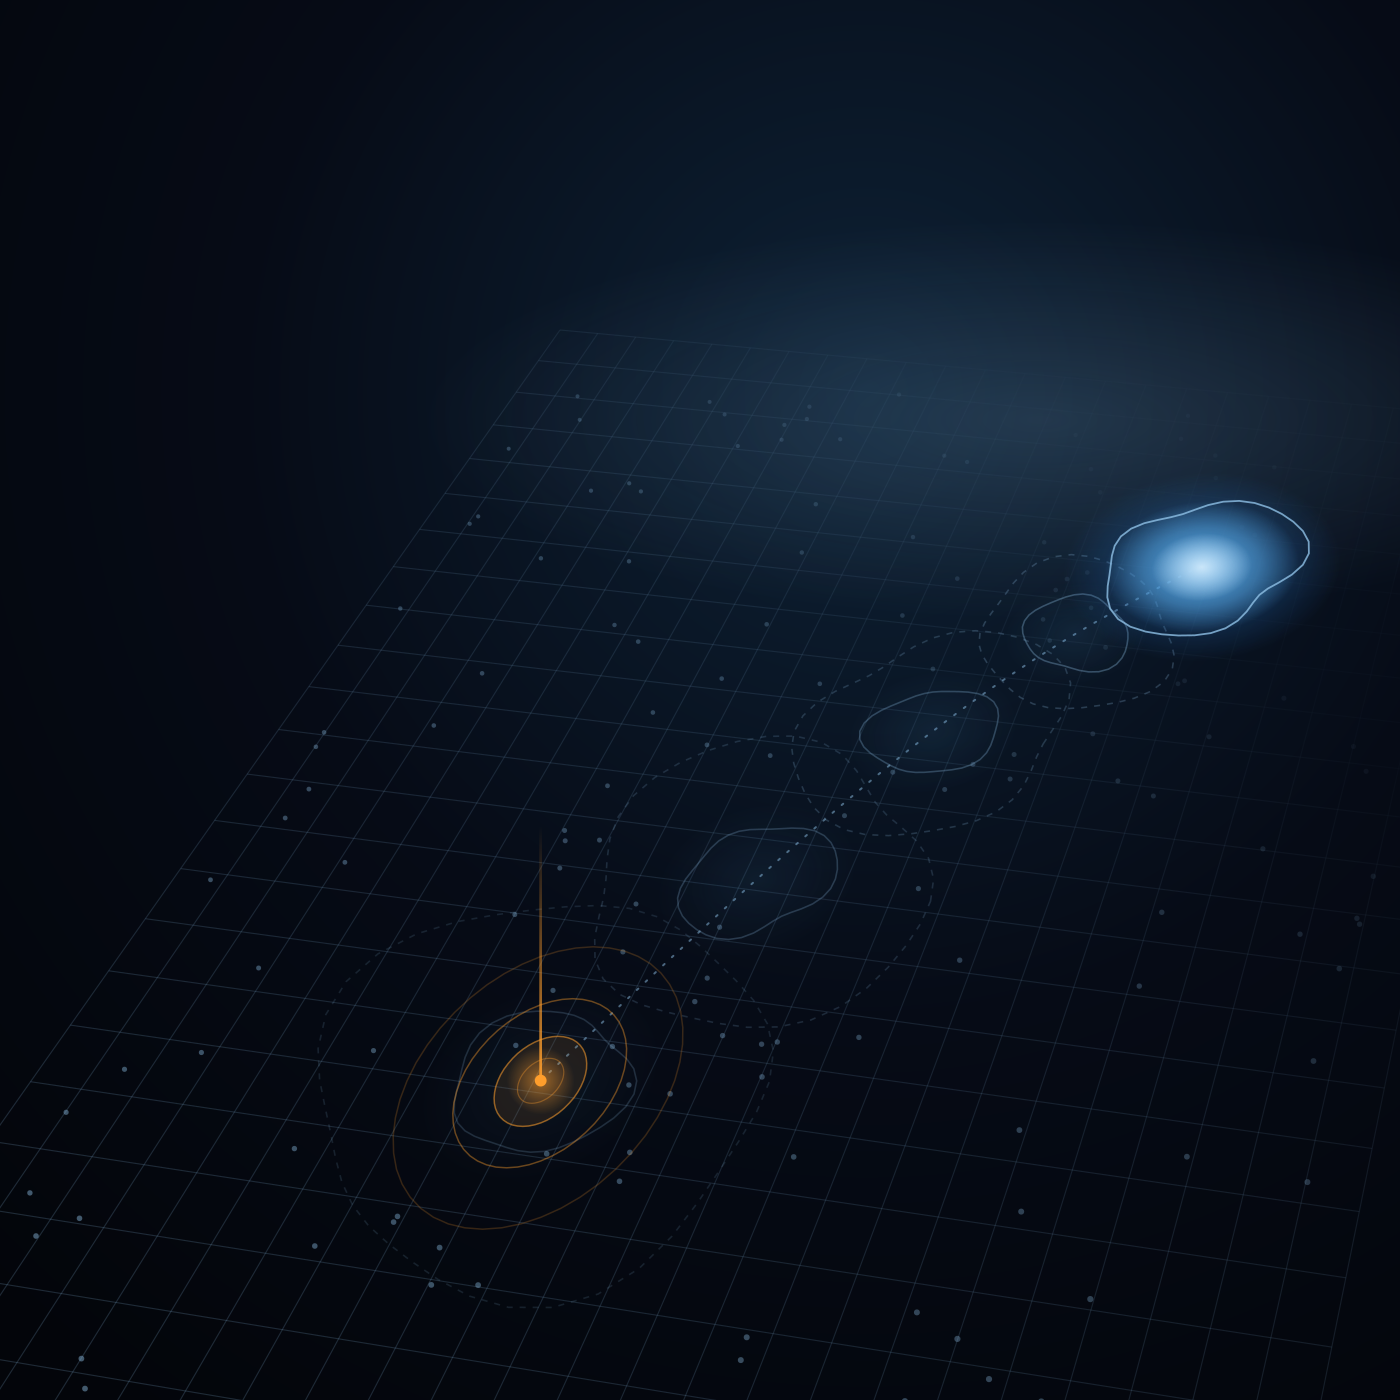
Abstract digital visualization with four translucent layered grids, interconnected by a vertical line marked with circular nodes, featuring blue and orange glowing points and a dark background with a faint grid and network lines.
Local ground truth
Our own stations calibrate every source against what's really happening.
Global sources
Satellites, radars and NWPs from NOAA and ECMWF, collected around the clock.
Digital illustration of a brain composed of interconnected white nodes and lines on a dark background, with four small square insets on the left showing different abstract data patterns connected to the brain by thin lines, representing data inputs for building a neural model.
Learning from the field
Trained on our proprietary archive of measured weather conditions.
AI models
Our own neural networks specifically designed for hyperlocal weather prediction.
3D visualization of a trajectory on a dark grid background showing a bright orange point with concentric circles at the start and a series of faint, translucent contours leading to a larger bright blue glowing area at the end.
Minutes to weeks
From nowcasting to medium-range planning.
68% more accurate forecasts
Beating today's most advanced models.

The industries we impact today

We turn advanced weather insights into actionable decisions that move safety, profits, and performance.


Energy
The grid runs on the weather

As the world shifts to renewables, energy has become one of the most weather-dependent industries on Earth. Generation, demand peaks, and grid balance all move with local conditions.

Cordulus delivers reliable weather insights rather than regional averages, so operators can forecast output and balance the grid accurately.

White check mark icon with rounded edges.
Advanced generation forecasts for wind and solar assets.
White check mark icon with rounded edges.
Better grid balancing and fewer costly imbalance penalties.
White check mark icon with rounded edges.
Confident trading and planning against real conditions.
Line graph showing solar forecast error RMSE against SARAH-3 satellite reference over the first 6 hours, where lower RMSE is better. The x-axis represents lead time in hours from 0 to 6, and the y-axis shows RMSE values from 40 to 110. Three forecasting models are compared: Cordulus (blue line with circle markers) showing a rising RMSE from about 43 to 85, IFS (ECMWF) (light grey dotted line with dots) and GFS (NOAA) (dark grey dashed line with dots), both remaining around 105-110 RMSE with little change over time.
Agriculture
The weather decides the harvest

Agriculture is one of the world's most weather-exposed industries. Every yield, every input, and every margin depends on the weather in the field.

It's where Cordulus began, and where our network is most dense. Thousands of weather stations turn hyperlocal weather into the timing that protects crops and lifts output.

At national scale, that means more resilient food production and less waste.

White check mark icon with rounded edges.
Higher yields from perfectly timed spraying, drilling and harvest.
White check mark icon with rounded edges.
Less waste - fewer inputs applied at the wrong moment.
White check mark icon with rounded edges.
Climate resilience for the farms feeding an increasing global population.
Line graph showing rain forecast skill over the first 12 hours measured by Critical Success Index (CSI) at 0.2 mm/h, with higher values indicating better performance. The x-axis represents lead time in hours from 0 to 12. The y-axis shows CSI values from 0.3 to 0.8. Three lines represent different methods: Cordulus in blue decreasing from about 0.78 at 0 hours to 0.39 at 12 hours, GFS (NOAA) in gray near constant around 0.29, and Optical flow in orange dropping sharply from 0.49 at 1 hour to 0.28 at 3 hours. Cordulus consistently outperforms the other two methods over the 12-hour period.
Construction
Minimise downtime, strengthen documentation

Construction runs on schedules, and weather is the one thing those schedules can't control. Delays, safety stand-downs, and disputes all trace back to conditions on site.

Cordulus brings reliable weather information to the table, so teams can plan around real conditions, protect their crews, and document exactly what happened.

White check mark icon with rounded edges.
Fewer weather delays through confident, data-led planning.
White check mark icon with rounded edges.
Safer sites with early warnings for wind, frost and rain.
White check mark icon with rounded edges.
Airtight documentation for claims and contract disputes.
Line graph comparing wind forecast error for the first 24 hours using mean absolute error (MAE) at 2 meters, showing Cordulus with a lower error around 0.37 to 0.55 and GFS (NOAA) consistently higher around 1.2 to 1.26, indicating Cordulus performs better. The x-axis is the lead time in hours from 0 to 24, and the y-axis is the MAE ranging from 0.2 to 1.4.
Motorsports
Races are won on the weather

In motorsport, the gap between winning and losing is often a single weather call. A shower that arrives a lap early or a track five degrees warmer than expected.

Cordulus puts track-specific forecasting in team's hands, turning weather from an unobserved variable into a competitive edge.

White check mark icon with rounded edges.
Smarter tire and strategy calls from real track conditions.
White check mark icon with rounded edges.
Contingency plans built on realistic race scenarios.
White check mark icon with rounded edges.
Weather removed as the variable no one could see coming.
Line graph titled 'Track temperature forecast' showing observed history and Cordulus forecast of track temperature in degrees Celsius over two days, with times on the x-axis from 06:00 to 12:00 the next day. The observed temperatures (gray line) peak near 60°C around noon and then fall to about 20°C overnight. The Cordulus forecast (blue line) closely follows the observed trend after the forecast issued time at 13:20, showing matching temperature rises and falls.
Road
Safe roads start with local weather

Every winter, road authorities balance public safety, tight budgets, and environmental concern, and every call is dependent on local conditions that regional forecasts can't see.

Cordulus provides government-approved hardware along with reliable forecasts, giving winter maintenance teams the necessary data to act at the right time in the right place.

White check mark icon with rounded edges.
Safer roads through earlier, better-targeted action.
White check mark icon with rounded edges.
Lower costs and less salt through data-driven planning.
White check mark icon with rounded edges.
A measurable step toward more sustainable maintenance.
Explore Cordulus Road
Line graph showing temperature forecast error (mean absolute error) at 2 meters over the first 24 hours. The x-axis is lead time in hours from 0 to 24, and the y-axis is MAE from 0.4 to 1.4. Cordulus has a blue line starting near 0.55 MAE quickly rising to about 0.9 then slowly increasing to just below 1.0 at 24 hours. GFS (NOAA) has a gray line consistently higher, starting near 1.27 and gradually rising to about 1.37 at 24 hours. The graph indicates Cordulus has lower forecast errors than GFS (NOAA) over the first 24 hours.

Let's build on the ground truth.

From real-time measurements to advanced forecasts, we turn weather into decisions. Let's have a talk about what that means for you.
A blurry close-up of a digital weather forecast showing a rain cloud icon, the text 'Sat 10-18', and '100%' indicating full precipitation probability.